Coffee Quality & Specialty Classification
End-to-end data science project analyzing what drives specialty coffee quality
using Coffee Quality Institute (CQI) data. The project combines exploratory data analysis,
statistical testing, metadata-only machine learning classification, SHAP interpretability,
and an interactive Tableau dashboard.
Models intentionally exclude sensory scores to reflect real-world pre-cupping decision making.
Overview
Specialty coffee is formally defined by cupping scores, but in practice many decisions must be made before sensory evaluation. This project investigates whether metadata such as origin, altitude, variety, and processing method can meaningfully explain or predict coffee quality.
Using CQI review data, I first explored quality distributions and group differences, then framed specialty classification as a binary machine learning problem (≥ 80 points vs < 80 points), carefully avoiding information leakage.
Key Questions
- ☕ What patterns exist in coffee quality across countries and varieties?
- ⛰️ Does altitude meaningfully relate to quality scores?
- 🤖 Can metadata alone help identify specialty coffee?
My Contributions
- Cleaned and standardized raw CQI data (altitude parsing, missing values, encoding).
- Performed EDA with distributions, boxplots, and correlation analysis.
- Conducted ANOVA tests to evaluate country- and variety-level quality differences.
- Built and compared multiple classifiers (Logistic Regression, Random Forest, SVC).
- Tuned the best model with cross-validation and custom probability thresholds.
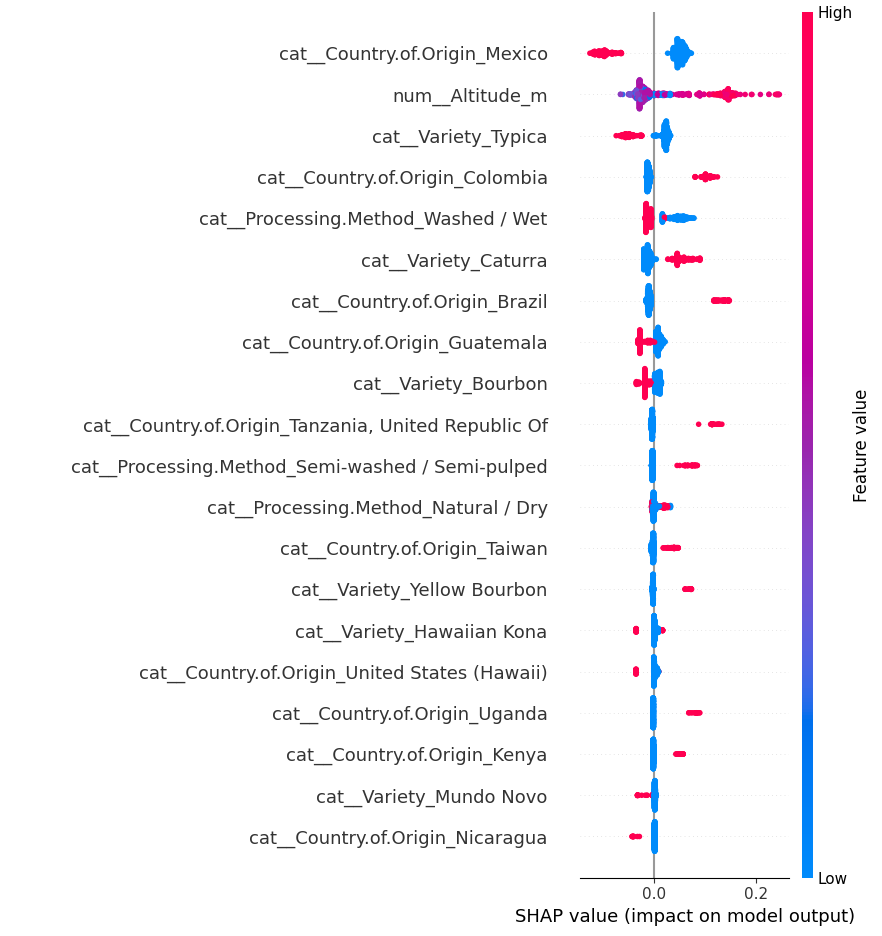
- Applied SHAP to interpret feature influence and model behavior.
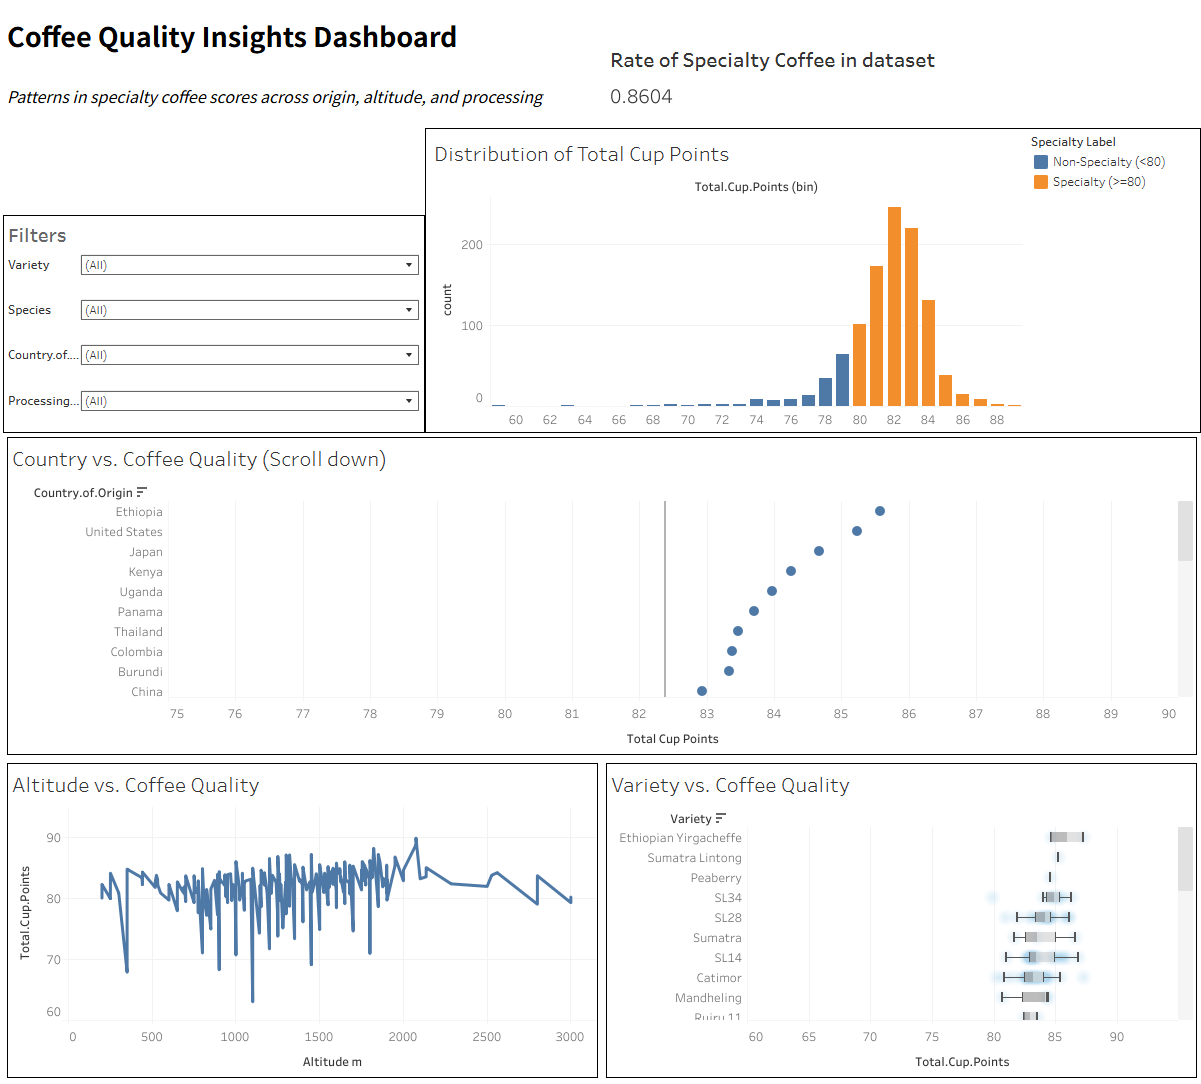
- Designed and published an interactive Tableau dashboard for exploration.
Tech Notes
Key Findings
- 📊 Most coffees cluster between 80–90 points, creating class imbalance.
- 🌍 Country and variety show statistically significant mean differences, with overlap.
- ⛰️ Altitude is positively associated with quality, but not determinative.
- 🧠 Metadata enables screening-level prediction, not definitive classification.
Screenshots